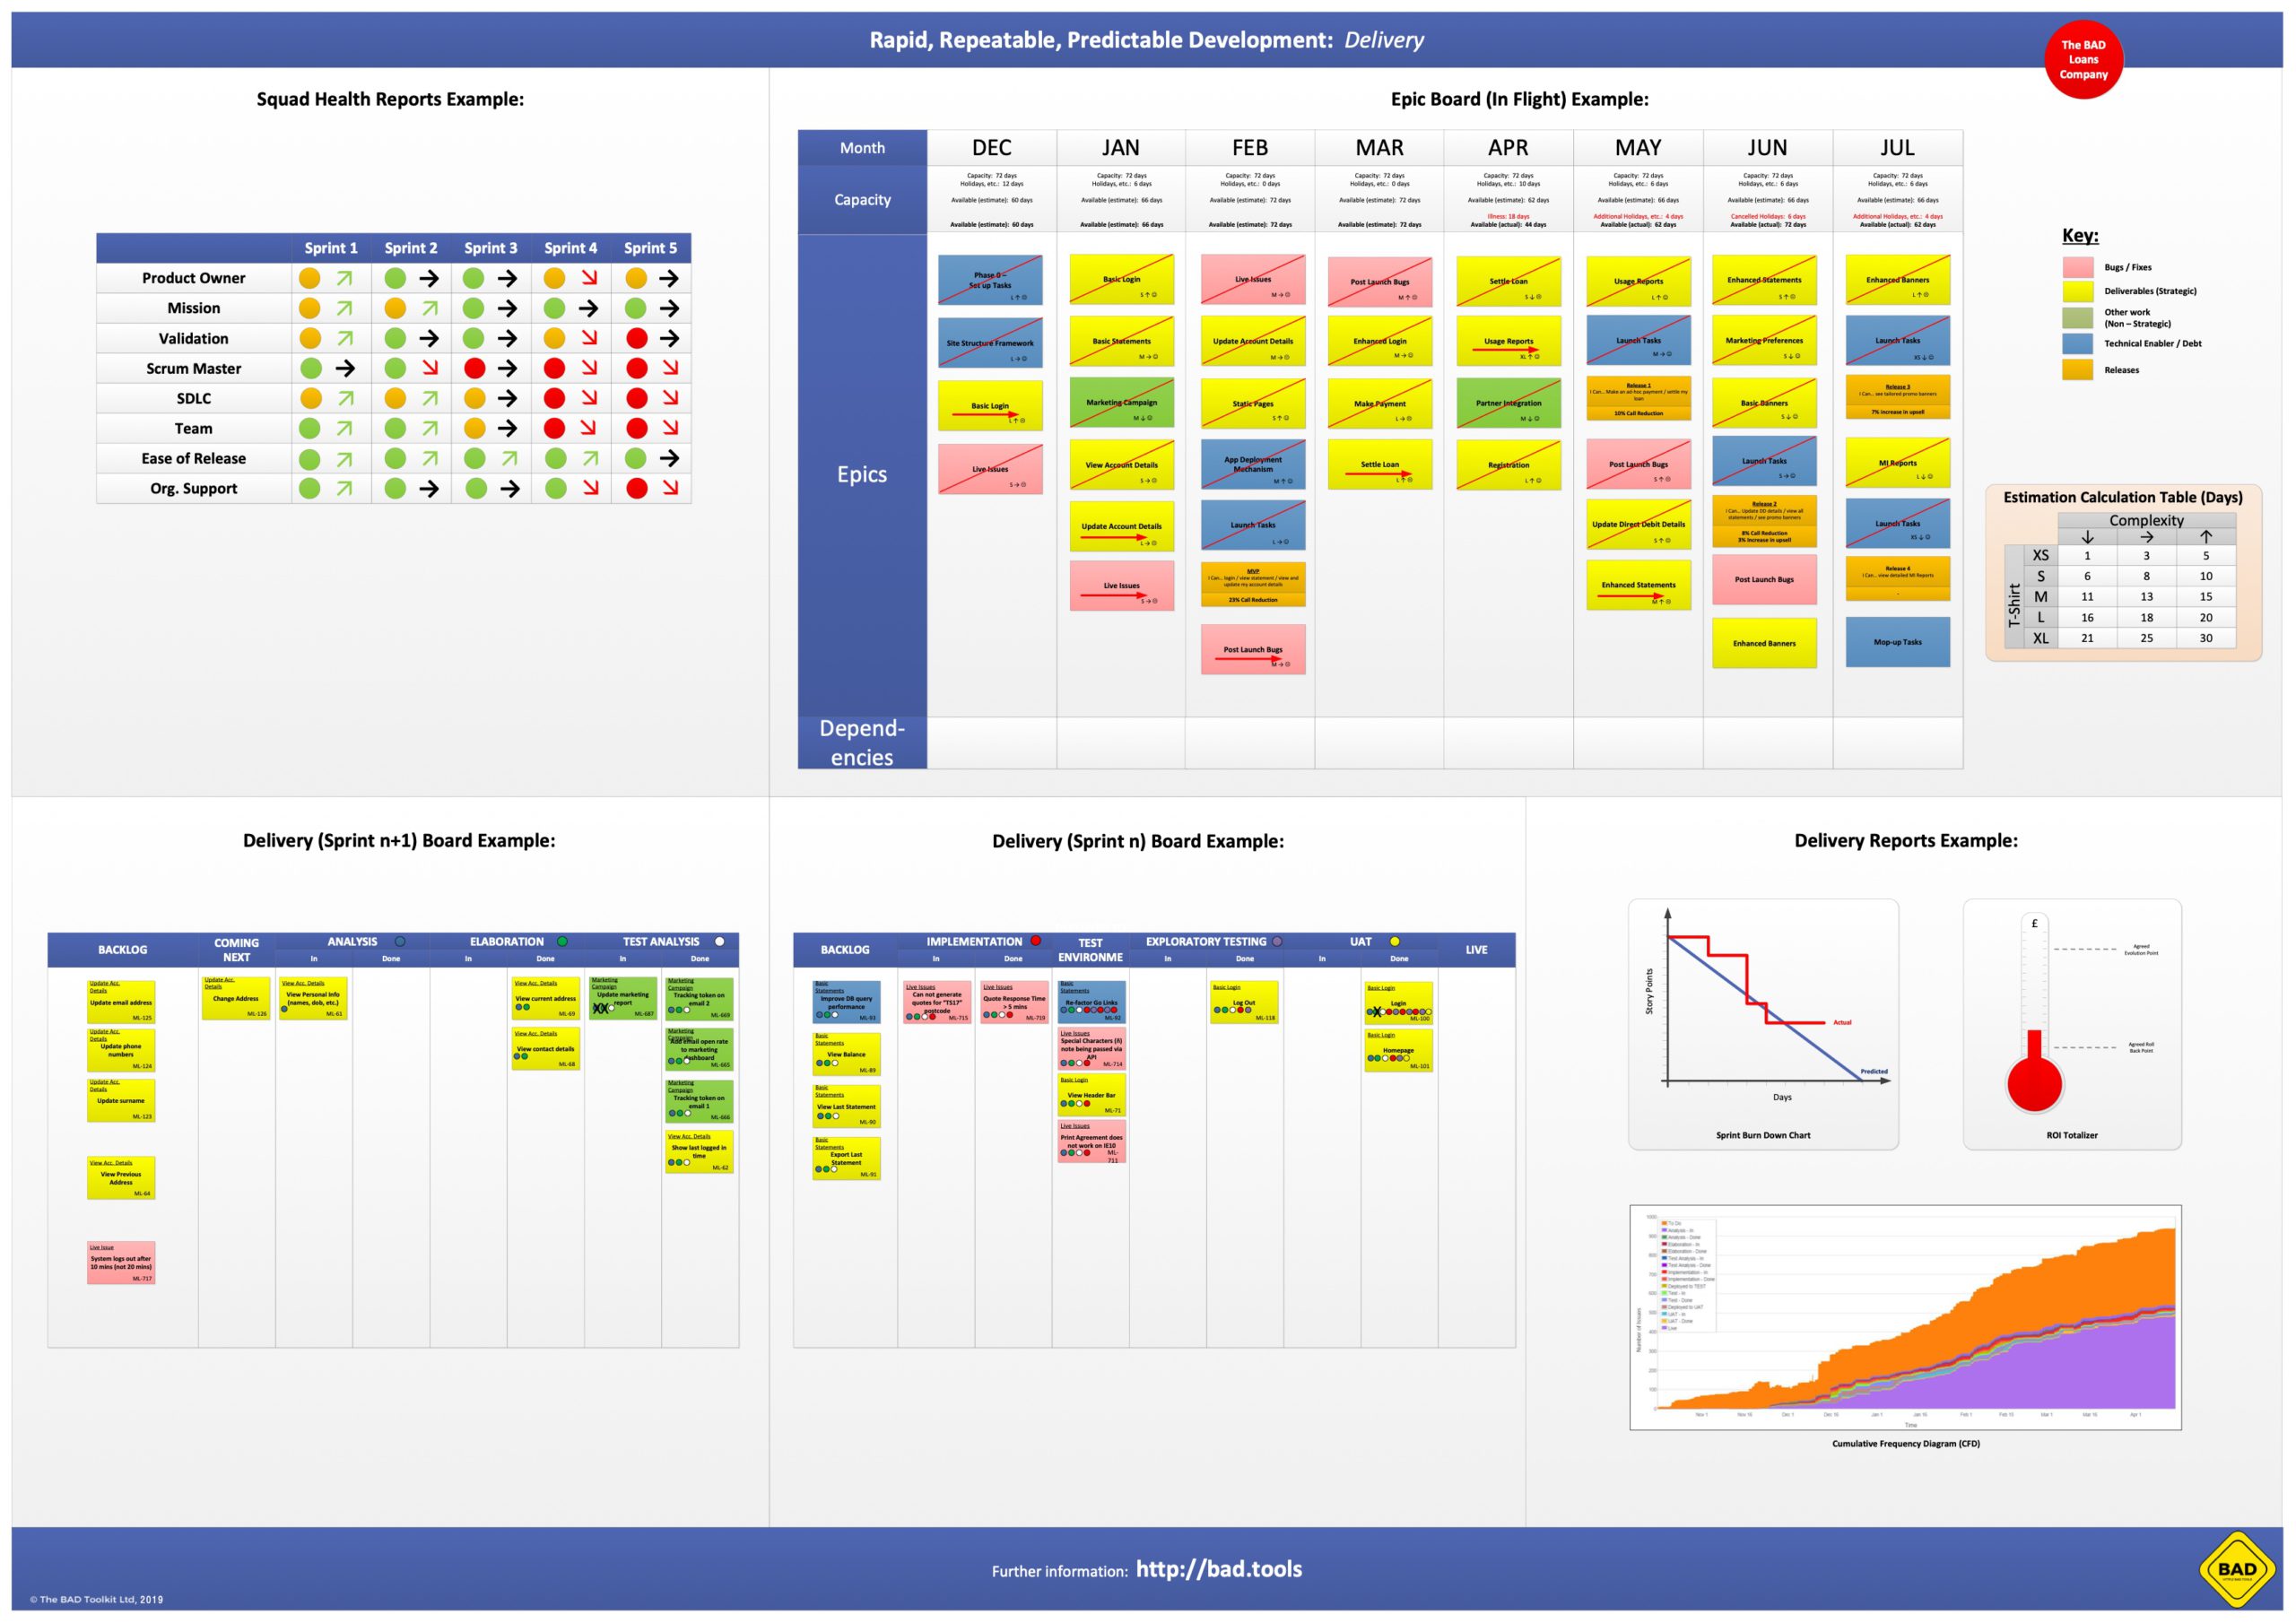
Our delivery approach
We focused on a two-stage Just In Time approach to optimise delivery efficency. Elaboration allows the team to break the medium size blocks down whilst Construction allows the team to productionise the process through a repeatable format.
Our Team Reports
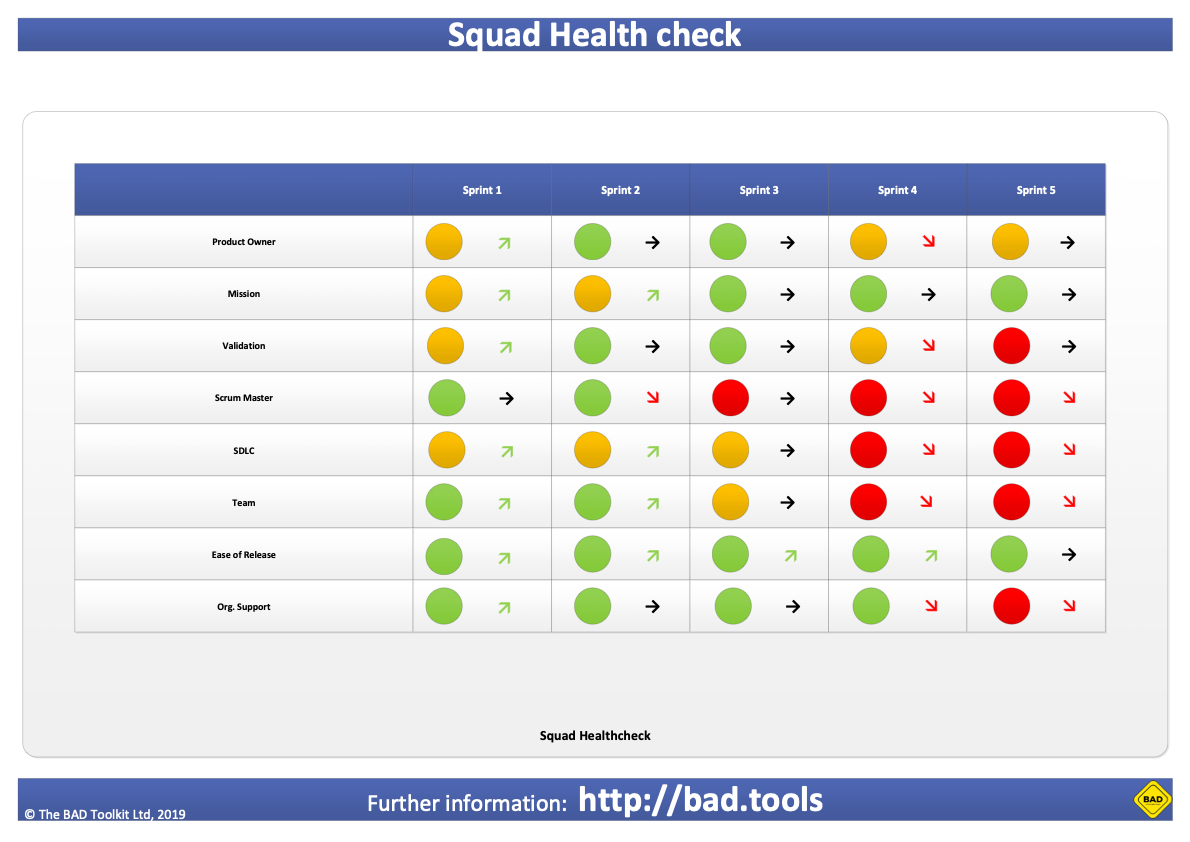
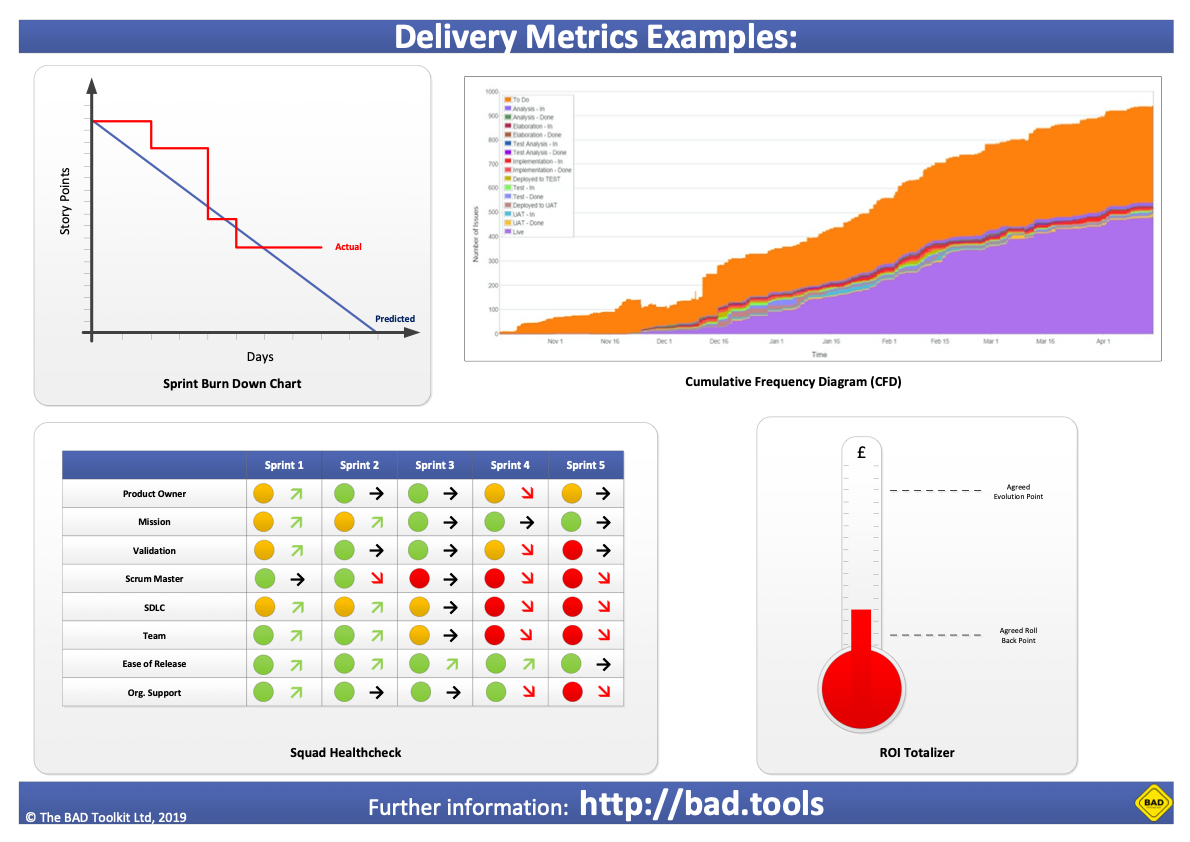
The team is constantly monitored on how they are feeling in relation to key areas of delivery. These reports are solely focused on the well being of the team, rather than their delivery throughput.
This helps us understand where the percieved challenges are and what the overall trend is amongst the team. By empowering the team to identify the issues action can be take to support them as they improve.
Our (In Flight) Plan
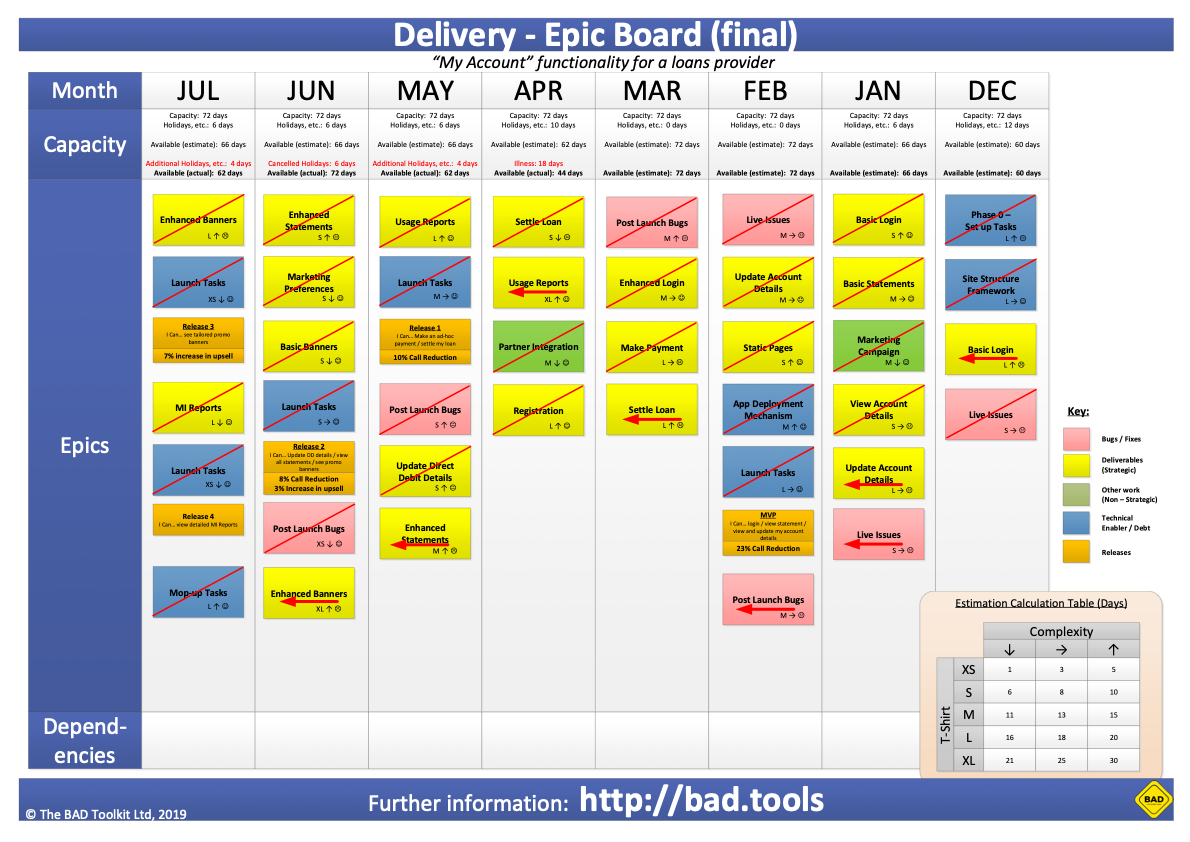
We kept the Epic Board that we created in Inception and it became our delivery plan for the team. This way everyone knew what was coming next.
The structure helped us deal with changes as well. New work was prioritised by the PO and inserted into the correct place (shifting the timelines out). Changing priorities mean simply re-ordering the board and completed Epics were crossed off whilst ones that slipped had their remainder simply carried over to the next column.
All this let us constantly communicate progress and mean that there were no nasty surprises as the original end date approached. The timelines went out but we could show we were constantly delivery what the PO deemed was the most important at the time.
Sprint Preparation Boards
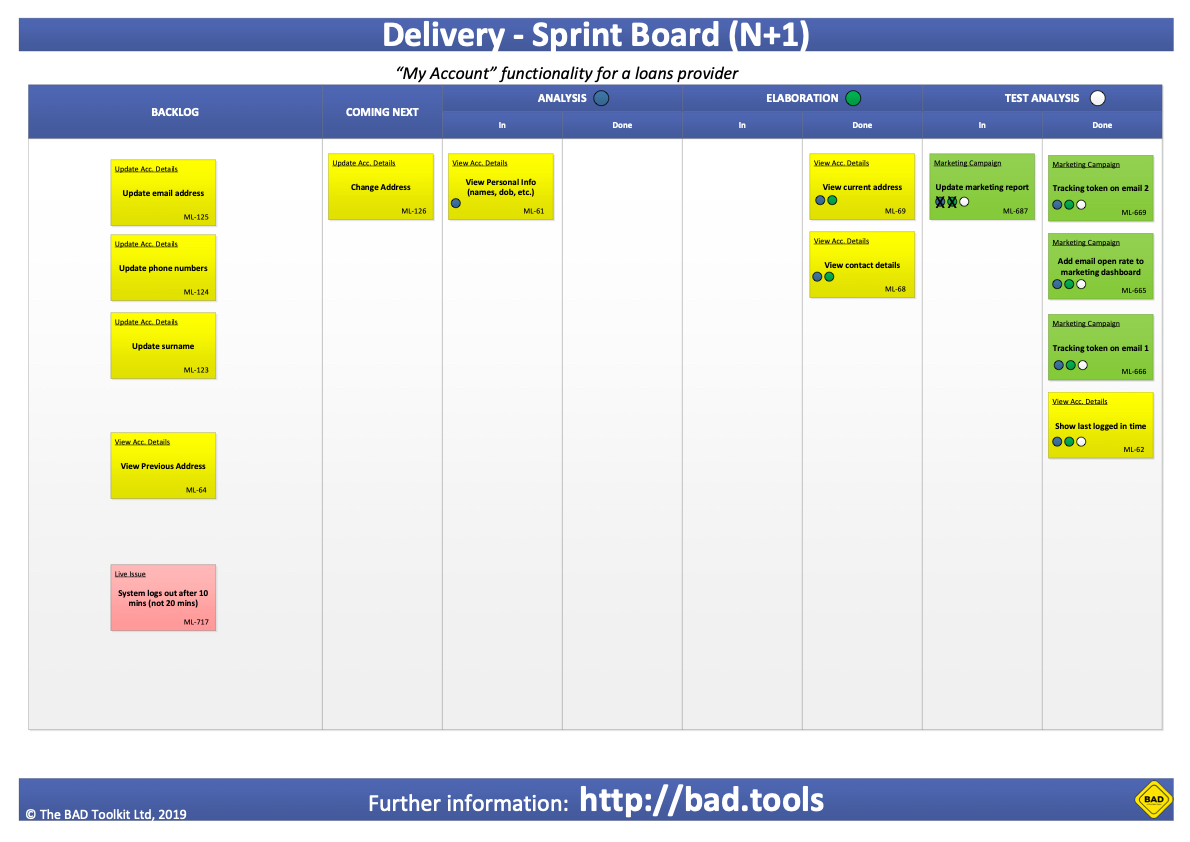
We are conscious that 3 Amigos pays a critical part in delivery and in order to work in a Just in Time way we needed to ensure that the 3 Amigos had their own workflow to feed into the sprint.
By creating an environment where the 3-Amigos prepare for Sprint 2, whilst the team is delivering Sprint 1 the team benefits from a lean delivery framework and Sprint planning is reduced to approximately 30 minutes.
Sprint Delivery Boards
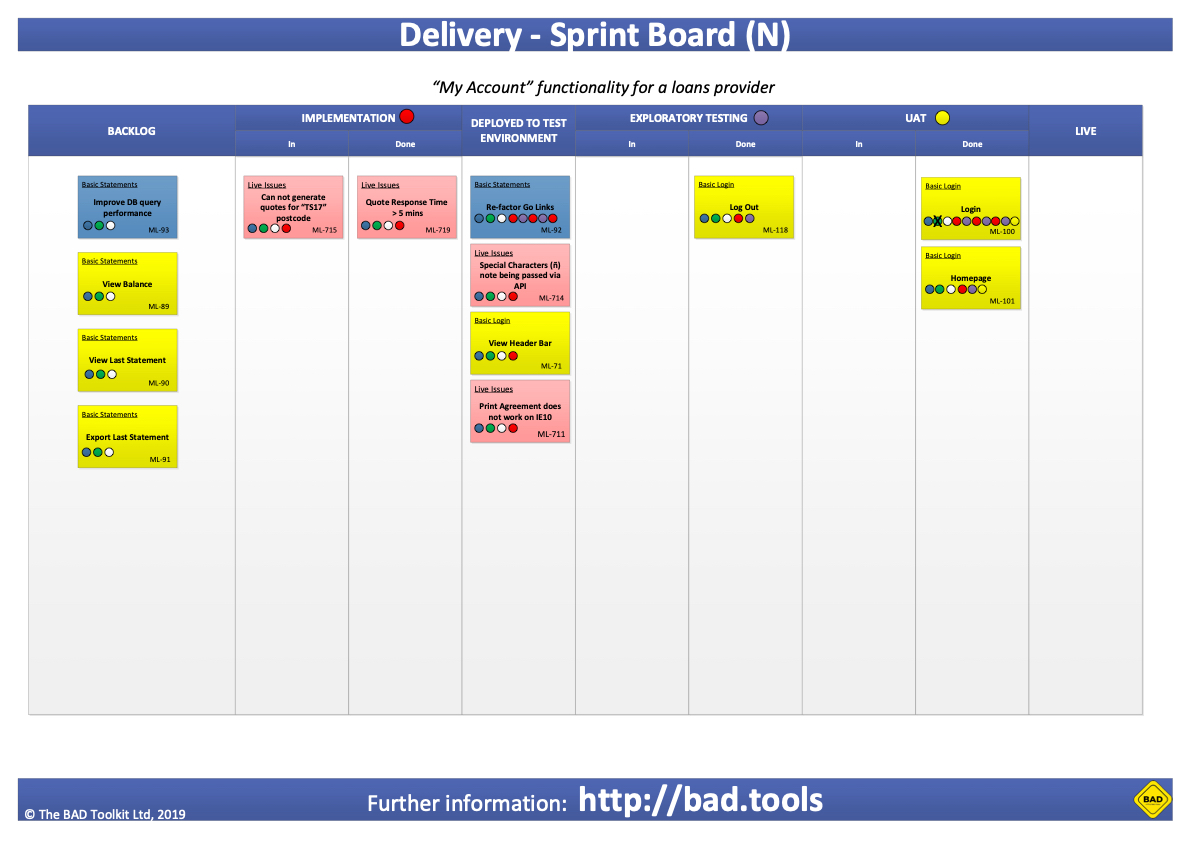
Sprint boards are pretty standard and we intentionally built ours around 3 key stages – build, test and sign off.
What we did in addition to this is monitor when tickets had entered each column. Using coloured dots, we could see any tickets that bounced between stages in the workflow (ie build -> test -> build -> test). These were then discussed either during the daily scrum or during the team retrospective.
Delivery Reports
In order to monitor the teams improvement, we utilised both burn down charts for the Sprints and Cumulative Frequency Diagrams across the whole workflow.
This let us understand where our issues were with Flow and Work In Progress and we could take steps to minimise them by focusing on the 7 areas of waste.
We also kept a track of the Value shipped by the team in the form of a ROI totaliser. This helped the team identify how they were progressing against their Projected Benefits identified during Inception.
